This blog has been written by a member of the Newground Flood Team.
As the topic of climate change has become more mainstream over recent decades, the terms ‘climate crisis’ and ‘climate catastrophe’ are now common prose in everyday conversations. As with any perceived threat facing the global population, there will always be those whose scepticism in the mainstream narrative remains steadfast.
On a planet of nearly 7.9 billion people who are collectively governed by 195 different member states, there’s bound to be some differences of opinion. The good news is that over 90% of us now believe and agree that our climate is changing. However, within this majority, opinions are very much divided around two key sub facets. Firstly, to what degree, if any, is climate change a result of human activity and intervention? And secondly, given the varied positions and lack of action by world governments, what level of threat does climate change actually pose?
A 2019 survey carried out by YouGov recorded the following responses…
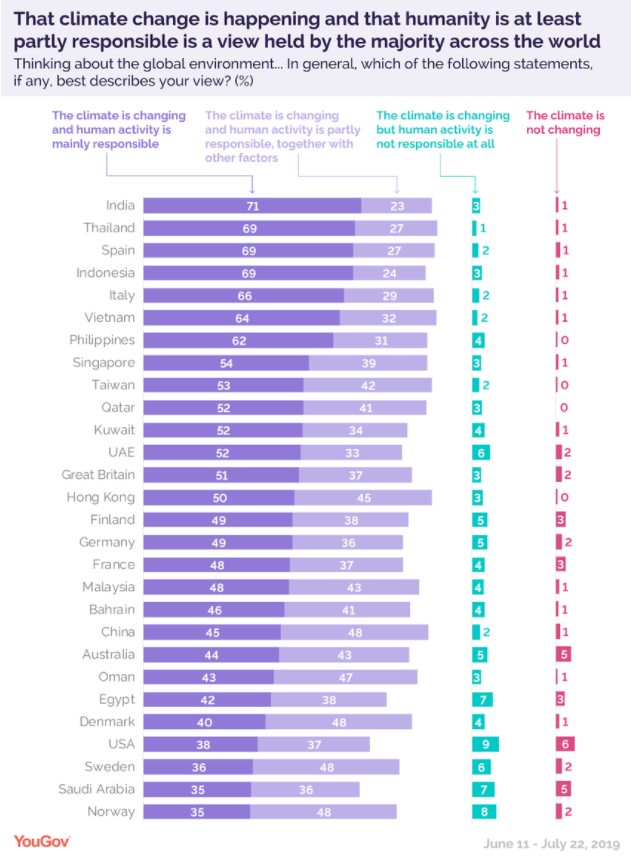
Image: YouGov
The dark purple column represents those who believe human activity is mainly responsible, while the light purple column represents those who believe that human activity is partly responsible, together with other factors.
Those belonging to the green column, who believe climate change is happening, but human activity is not responsible at all, often propose global warming is a result of natural planetary cycles, with some even citing the changing of the polar ice caps on Mars as evidence. Climate change sceptics, shown in the far-right column in red, simply do not believe that our climate is changing at all, and that it’s all just a hoax.
Taking action to counteract climate change and reduce its impact is quite simply nothing short of a monumental challenge! And if you want to solve a problem, it helps to first understand the cause. Otherwise, how else can it be addressed effectively, especially with the stakes and economic costs so high. It’s in this area where the much broader split of opinion lies – namely the causes and threats posed by climate change.
Even though the majority of the world agrees and acknowledges that our climate is changing, governments purporting that human activity is only partly responsible, or that the threat posed is grossly over-estimated, means that policy change is unlikely to take place; particularly if those economies are reliant on the production or consumption of fossil fuels. And unfortunately, a global problem requires a global effort!
The impacts of climate change are multi-faceted. Droughts, wildfires, crop failures, ocean acidification, flooding and ecosystem failures are just a handful of the many impacts that lay ahead of us. But there is one impact which will truly change the face of the Earth – sea-level rise!
Sea-level rise is different, though. It’s the slow drip filling the bucket, and it’s slowly moving global coastlines inland! The concept is much more difficult to grasp for many, and like climate change, there are those who believe sea-level rise to be a hoax. When news articles around rising sea-levels appear in online newspapers, a common theme amongst the comments sections is that it must be a hoax simply because we were given the same message 30 or 50 years ago, and nothing has changed since. Locations purported to be underwater by the year 2020, are in fact, not.
So… Is sea-level actually rising? Is our warming planet a result of human activity, natural planetary cycles, or both? And, how do we know?
For hundreds of years scientists have made observations, embarked on expeditions, and carried out experiments which have neatly knit-together the fabric of reality around how our planet works; not just in relation to its internal environmental processes, but also how these processes are affected by external factors such as the Sun and our neighbouring planets.
In 1824, Joseph Fourier calculated that a planet the size of Earth, at our distance from the Sun, should be much colder than it is, and proposed that something within our atmosphere must be acting like an insulating blanket. In 1856, Eunice Foote showed that carbon dioxide (CO2) and water vapor in the Earth’s atmosphere traps infrared radiation (heat) and prevents it from escaping.
In 1896, Swedish scientist Svante Arrhenius, first predicted that changes in levels of atmospheric carbon dioxide could substantially alter the surface temperature of the Earth through ‘the greenhouse gas effect’. This prediction was later confirmed in 1938 when Guy Callendar directly connected increases of carbon dioxide levels within the Earth’s atmosphere to Global Warming. In 1941, Milutin Milankovic linked Ice Ages to the Earth’s orbital characteristics, and in 1956, Gilbert Plass formulated the Carbon Dioxide Theory of Climate Change.
Throughout the 20th century, hundreds of scientists and experts have been studying climate change. We have developed satellites capable of accurately measuring sea-level and the atmospheric composition of the Earth, and developed technologies enabling the analysis of ice core samples taken from both Greenland and Antarctica. Ice core sampling allows scientists and researchers to identify the Earth’s atmospheric makeup in terms of both temperature, by analysing isotopes, and greenhouse gas composition at different points throughout history, by analysing the tiny air bubbles within the ice that were present when those layers of ice were formed hundreds-of-thousands of years ago.
We have ice core samples from Greenland dating back 140,000 years and ice core samples from Antarctica dating back 800,000 years. The data from these samples, which were taken from the opposite ends of the Earth, corollate exactly and tell precisely the same story of our past. Like rings within a tree trunk, ice core samples provide an indisputable truth and historical record, created not by man, but by nature itself. In this regard, we have an amazingly accurate picture of the Earth’s history and natural planetary cycles, created long before mankind walked the Earth.
The Intergovernmental Panel on Climate Change (IPCC) is the United Nations body for collating and assessing the scientific evidence related to climate change. Created in 1988, by the United nations Environment Programme (UN Environment) and the World Meteorological Organization (WMO), the IPCC has 195 member countries and has always been independent in the nature of its findings and reporting. The latest IPCC report on climate change (released in 2021) is the work of more than 200 scientists and draws on thousands of research studies.
For the record, consensus amongst 99% of scientists is that climate change is not only real, but it is the direct result of human activity and intervention due to the combustion of fossil fuels, deforestation, and changes in land use. COP26 saw unanimous recognition that the burning of fossil fuels, specifically coal, was at the heart of our warming planet. Atmospheric concentrations of carbon dioxide are now higher than at any other point in the last two million years. And, atmospheric Methane and Nitrous Oxide are now at higher levels than at any point in the last 800,000 years! For reference, anatomically modern homo-sapiens evolved around 300,000 years ago.
Ice ages are closely linked to the Milankovitch Cycles. The Milankovitch Cycles relate to three cyclical patterns which help to predict how the Earth moves as it orbits around the Sun, namely the tilt, eccentricity, and the procession. Over each one-hundred-thousand-year-or-so cycle, slight fluctuations in the Earth’s tilt and orbit around the Sun (eccentricity) affects the amount of solar radiation that reaches the Earth. The Earth’s orbit around the Sun is not perfectly circular, and depending on the strength of the gravitational pull from Jupiter and Saturn, in contrast to the gravitational pull from the Sun, the Earth can either be pulled slightly further away from, or closer to the Sun during its orbit. The Earths angle of tilt, processions and distance from the Sun all affect the level of solar radiation it receives.
For the last three to four million years, the Earth’s ice age cycles of warming and cooling have maintained a regular pattern in-step with the Milankovitch Cycles, with the process of going from cold to hot and back again taking approximately 100,000 years. One of these cycles comprises of 80,000 years of cooling, bringing an increase in polar ice, followed by approximately 20,000 years of warming, during which the polar ice recedes and sea-level rises again.
These external planetary factors, together with cyclical fluctuations of Earth’s natural internal environmental processes, helps to move the planet between periods of warming and cooling. Although this is a very slow process, it’s cyclical! And, we have the evidence to prove it. In fact, it is these same processes which result in the Sahara alternating between desert and savanna grassland every 20,000-years.
The pattern of the Milankovitch Cycles over hundreds-of-thousands of years, show us that during our current interglacial warm period, our planet should have already begun to enter a cooling phase, and that today we should now be in a mild ice age. However, for the first time in millennia, this has not happened. While it’s difficult to conceive that mankind, in such a short timeframe here on Earth, has directly altered millions of years-worth of cyclical processes on a planetary scale, it is indeed completely true. It’s a fact. And it’s a sobering thought!
There are two separate, but important, key events in our past. Early humans evolved around 200,000 – 300,000 years ago, with evidence of modern man and the earliest recorded civilizations that we know of dating back around 12,000 – 16,000 years ago.
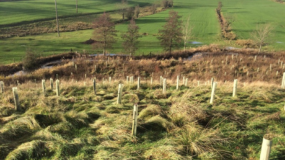
Firstly, around 10,000 years ago when our planet was at a warm peak and should have begun the gradual process of cooling, our ancestors discovered agriculture and the process of farming. In addition to the mass availability of food helping our species to thrive and multiply, it also led to the decimation of forests. As trees were chopped down to make way for farmland, the carbon dioxide (CO2) that was stored within them was released into the atmosphere causing the planet to warm, albeit ever-so-slightly, but just enough to offset the process of natural cooling and help to maintain a stable climate, and a stable sea-level, for the last 10,000 years! Think back to the photographs at the beginning of this blog, and this helps to explain why the concept of rising oceans is difficult for so many of us to imagine. Throughout all recorded human history, a stable ocean and coastline is all we’ve ever known.
Secondly, and more recently, in 1712 Thomas Newcomen invented the first widely used steam engine, giving birth to the Industrial Revolution and the industrial scale use of coal as a fuel. The advancements in technology as a result have helped the Earth’s population to grow at an exponential rate, but it has also released unprecedented amounts of extra CO2. Although the Earth has a natural CO2 cycle, whereby carbon dioxide is naturally reabsorbed by plants and animals, the huge release of this extra CO2 as a direct result of the Industrial Revolution, cannot be absorbed, and its affects are now taking hold.
What’s really important to know, is that the Earth is made up of very complex systems which are hyper-sensitive to the smallest of changes in average temperature. For the last 2.5million years across many, many ice ages, global ‘average’ temperature has fluctuated (risen and fallen) by only 5 degrees Celsius (9 degrees Fahrenheit).
According to the National Oceanic and Atmospheric Administration (NOAA) the current global average temperature of our planet is 13.9 degrees Celsius. Elon Musk helped to put this into context by stating that relative to absolute zero, -5 degrees Celsius would put New York under a blanket of ice, and +5 degrees Celsius would put New York under water!
To achieve the IPCC target of limiting a rise in global average temperature above pre-industrial levels to no more than 1.5 degrees Celsius, would require the world to reduce annual CO2 emissions by 48% by 2030, and reach net zero by 2050. It would also require reducing Methane (CH4) emissions by 33% by 2030, and 50% by 2050. These targets are now considered by many as a practical impossibility, especially without the agreement and cooperation of the larger developed nations responsible for the bulk of greenhouse gas emissions. Consensus is that warming of at least 2 degrees Celsius can be regarded as a given.
The chart below, produced by Sea-Level Rise expert John Englander and adapted from Hansen & Sato, spans the last 400,000 years, and shows the last four ice age cycles with the peaks and troughs representing the Earth’s warming and cooling cycles. Approximately 120,00 years ago at the peak of the last warm period when most of our planet’s ice had melted, sea-level was 23ft higher than it is today! The graphs show the correlation between the level of atmospheric carbon dioxide (CO2) in parts per million (PPM), with global average temperature (relative to zero), and the rise and fall in sea-level.
What’s important to know, is that while each of the three lines are linked and follow the same trend, there is a relatively small delay, or ‘lag’, between each of them, which is difficult to see given the scale of the graphs. CO2 levels rise first (the green line) which then causes an increase in global temperature (the red line), which then in turn melts the ice and results in sea-level rise (the blue line).
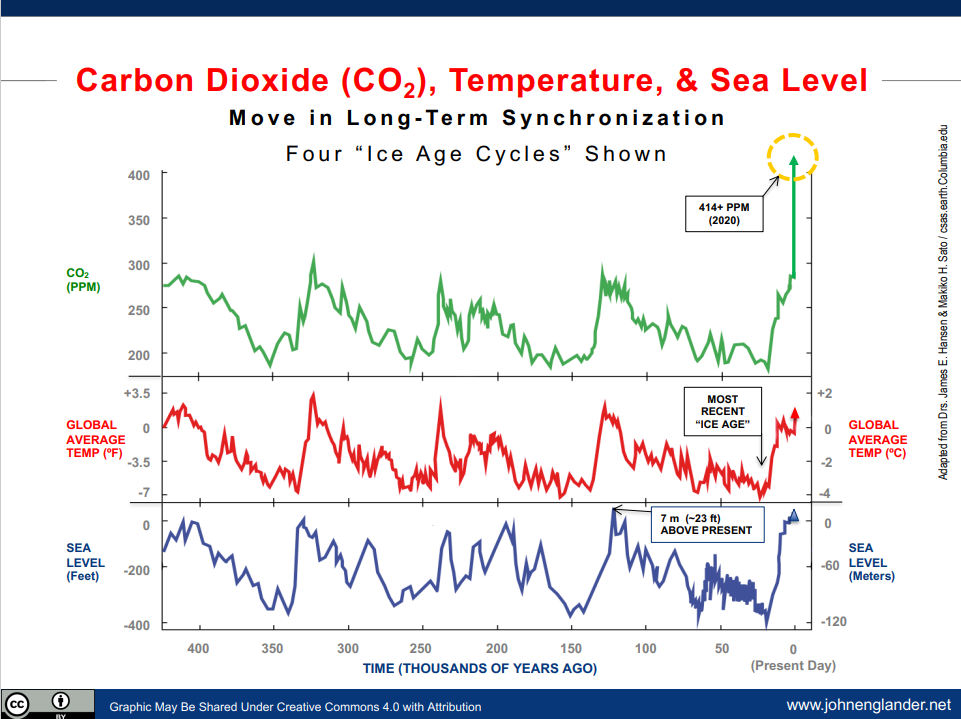
Image: John Englander. High Tide on Main Street: Rising Sea Level and the Coming Coastal Crisis.
As it just so happens, human civilisation appeared right at the end of the last warming period, at the tip of the very last peaks on the graphs above! For the entirety of recorded civilisation, sea-level has remained stable. Without our presence, the Earth would have begun to enter the next natural cooling cycle, but this didn’t happen.
The problem is the green line. As can be seen from the sudden spike, levels of carbon dioxide in the Earth’s atmosphere has increased exponentially over the last 250 years – right from the moment we started burning fossil fuels. In June 2022, CO2 levels reached a peak of 421ppm. We are already starting to see the land-based ice on Greenland melting at ever increasing rates. In fact, the rate has tripled in the last 30 years!
The Greenland Ice Sheet covers only 1.2% of the Earth’s land surface but stores around 7.4m (approximately 25ft) of global sea-level rise in ice which is going to melt. By comparison, the Antarctic Ice Sheet, which covers 8.3% of the Earth’s land surface, stores around 58m (close to 200ft) of sea-level rise.
Although ice is stored at other locations around the world, such as in the ocean and on mountain tops, it bears virtually no impact by comparison to the land-based ice on Greenland and Antarctica, which together store the bulk of global sea-level rise. Interestingly, sea-level does not rise equally around the globe. As land-based ice melts, the loss of ice mass away from the polar regions slightly changes the Earth’s gravitational field, creating unique patterns of sea-level change in the global ocean.
Since 1900, sea-level has risen about eight inches (21cm) on average. Although this doesn’t sound like much, three of those eight inches have occurred since 1993. For the 100-year period between 1900 and 2000, sea-level rose between 1.2mm and 1.7mm per year on average. In the 1990s the rate of sea level rise doubled, and it is currently rising at around 5mm per year on average. We know this to be true due to historical tide gauge data, and extremely accurate measurements taken from space via orbiting satellites.
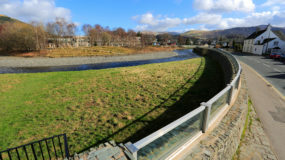
Those purporting that the photographic images comparing landmarks at the start of this blog are proof of a sea-level rise hoax, are quite simply wrong. An average rise of eight inches globally, means that some locations will have experienced more, and others less. However, such an increase would be almost impossible to detect by comparing two photographs taken a century apart, especially considering other factors such as the changing of the tides each day, weather-related events, coastal erosion and beach restoration, all of which are deceiving to a visual snapshot.
The comparison images shown at the start of this blog denouncing sea-level rise as a hoax, span a one-hundred-year timeframe, during a period in history of very stable sea-level. Effectively, it’s akin to visiting the harbour for 20 minutes at high tide, and then refusing to believe that tide rises and falls each day.
Though not a photograph, the image of the Florida peninsula below would be a much more appropriate example to use for such a comparison. The image on the left depicts the Florida coastline as it is today. The central image depicts the coastline 20,000 years ago at the end of the last cooling period, with increased ice and sea-level -390ft lower than it is today. The image on the right depicts the coastline 120,000 years ago, when the ice had melted and sea-level had risen to +25ft higher than it is today. We know that global coastlines were once much further inland than they currently are through ground sediment analysis and the discovery of ocean fossils hundreds of miles away from today’s shorelines.
As the amount of ice coverage on the planet reduces and there is less ice to reflect the incoming light and heat radiation from the Sun, more heat energy is absorbed into the darker oceans and the warming process speeds up. The rate at which sea-level is rising has already started to double. The doubling effect is what leads to exponential rates of growth. Like grains of rice on the squares of a chess board, the doubling effect will lead to an exponential rise in sea-level as the Greenland and Antarctic ice sheets melt.
Up to 90% of all heat energy from the Sun is stored within the oceans, and as the oceans warm and water molecules expand, seawater increases in volume through a process called thermal-expansion, which also contributes to rising sea-levels. Around four inches – half of the eight inches of sea-level rise this century, are due to thermal expansion, which on the grand scheme of things ahead of us, will actually have little effect in comparison to the melting of the Greenland and Antarctic glaciers. Furthermore, as the oceans warm and expand, they also release stored carbon dioxide, which further contributes to rising CO2 levels.
As a planetary species, even if it were possible to go carbon neutral today with zero reliance on fossil fuels, there is already enough heat energy stored within the oceans to continue the process of warming and melting for hundreds of years to come.
Firstly, it means that sea-level rise cannot be stopped. However, contrary to what some may believe, sea-level rise is not an extinction level event for our species. As shown on the CO2, temperature & sea level rise graph above, the most recent peak on the blue line illustrates that human civilisation arrived at a time when the majority of the Earth’s freshwater resource was already in the form of a liquid, rather than ice. And even though ice is still present in the polar regions, it’s a relatively small amount compared to the depths of an ice age.
So, what would the world look like if all the ice were to melt? The red areas on the map below illustrate which regions of the globe would be submerged underwater – it’s not as bad as you may think!
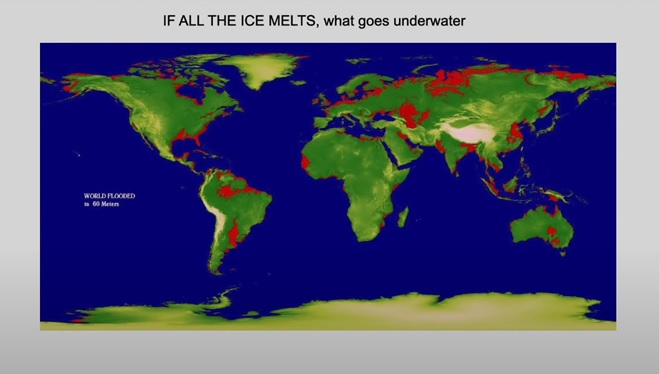
Image: John Englander RI Lecture.
Although the impact upon total land surface appears relatively small, it must not be underestimated. As can be seen from the Rockefeller Foundation image below, throughout history we have built hundreds of major cities on coastlines, which will present a significant challenge for us as our oceans rise. Interestingly, twelve inches (1ft) of vertical sea level rise moves global shorelines inwards by about 300ft on average, and an ever-inwardly creeping shoreline will inevitably displace millions of people and put cities underwater.
It is estimated that a rise in sea-level of 1m by the year 2100 will directly affect an estimated 410 million people living in coastal regions around the globe. According to the World Economic Forum, Dhaka – Bangladesh (population 22.4million), Lagos – Nigeria (population 15.3 million), and Bangkok – Thailand (population 9 million) could all be completely submerged by the end of the century. The country with the most people expected to be at risk by 2100 is China, with 43 million people living in precarious coastal locations susceptible to sea-level rise.
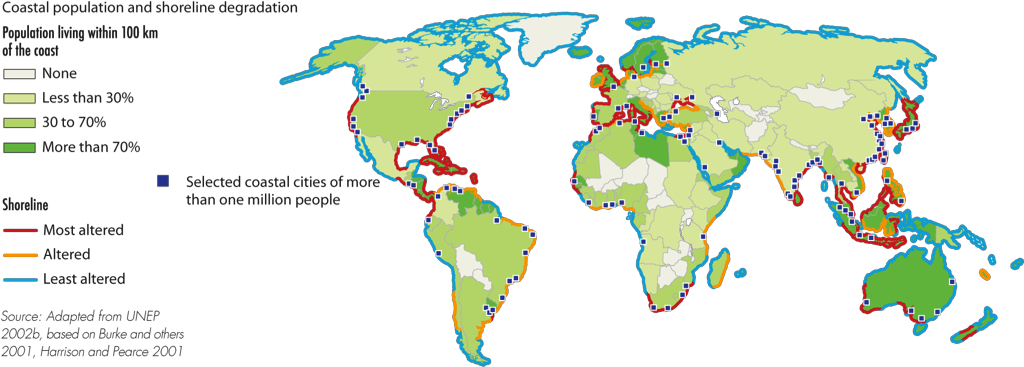
Coastal population and shoreline degradation. Image: Grida
So… How much and how fast will sea-level rise? The frustrating answer is nobody really knows. As there are a number of variables affecting the speed and rate at which our land-based ice will melt (a key one being what we do in the meantime to curb global warming), accurate projections are difficult to make, but computer models are getting better at this as we monitor ice melt and gather more data. What we do know for a fact is that the process has started, the ice is melting at increasing rates, and the rate at which sea-level is rising is now doubling!
Furthermore, historical data tells us that sea-level does not always rise steadily; the rate at which sea-level increases changes due to the many factors and variables in the equation, which ultimately makes future predictions incredibly difficult. But what is worth noting, is that all of our previous sea-level rise projections over the last several decades have all been underestimated, with actual sea-level rise surpassing expectations.
As can be seen in the graph below from www.nrdc.org, very different scenarios project very different outcomes. However, in what is regarded as an extreme worst-case scenario (a world where we fail to curb future emissions), it’s expected that we could see as much as 2.4m (8ft) rise in sea-level by 2100. The last time the earth had a sudden change in sea-level was 14,000 years ago, when sea-level rose 20 meters (65ft) in just 400 years. That’s an average of 0.5m (1.5ft) every decade!
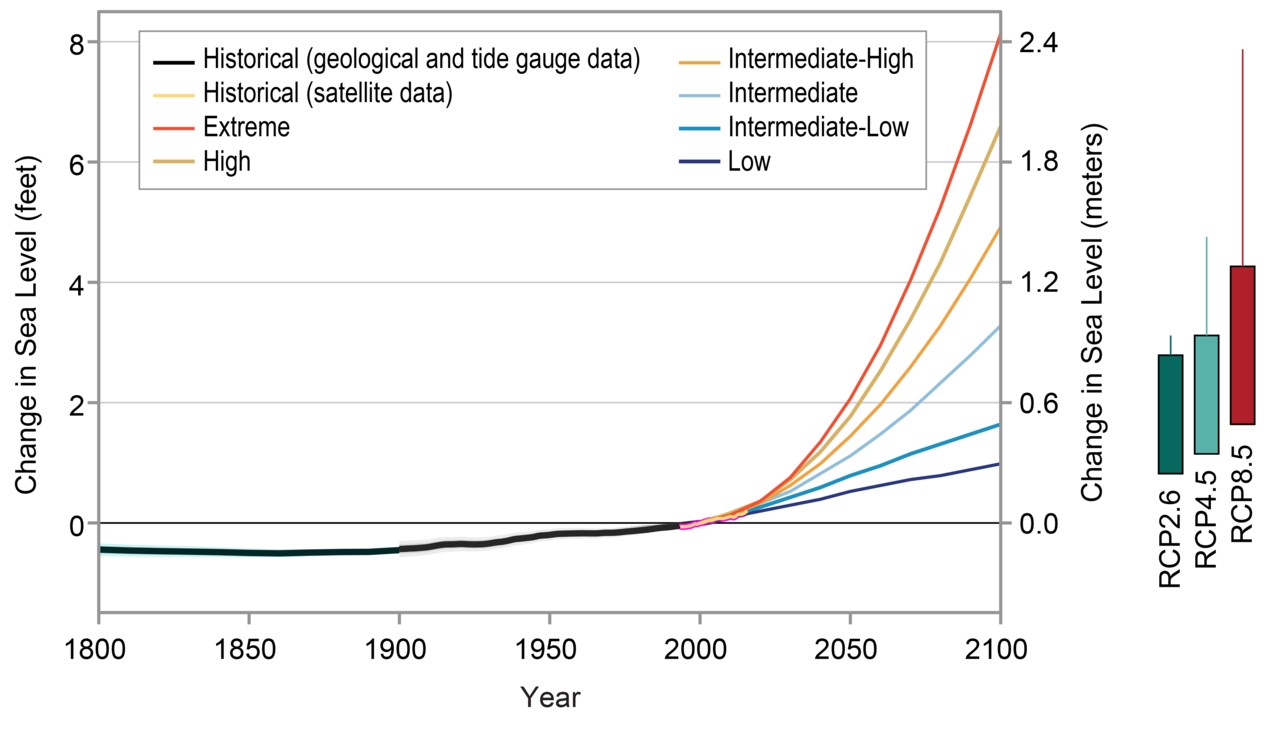
National Climate Assessment, Chapter 2, KM4: Sea Level Rise.
When the Greenland and Antarctic ice sheets have completely melted, sea level will be 64m (212ft) higher than it is today. And depending upon what action we take and how the future unfolds, this could take 300 years, or it could take 3000 years. Nobody really knows. However, the impacts of sea-level rise will become more and more prevalent this century, with millions of people being forced to relocate, and damage to critical infrastructure expected to run into the trillions of dollars.
As John Englander explains, the good news is two-fold. Firstly, we can see this threat coming. We know it’s in our future, and not many global threats and natural disasters grant us the gift of foresight. Secondly, we have time to act in order to mitigate the worst impacts, but we need to do it now. Huge reductions in CO2 emissions from the worst polluting nations will be needed, and technological advancements in carbon sequestration and the replacement of fossils fuels will also be required.
As a planetary species we are facing the greatest challenge we’ve ever known, and we will need to adapt, relocate, plan, and prepare for the changes that are coming. We are at the cusp of a significant rise in sea-level the likes of which modern man has never seen. It cannot be stopped, and only as a species can we work together to minimise the impact of what awaits us.