This blog has been written by The Flood Hub People.
As climate change has become more mainstream over recent decades, terms like ‘climate crisis’ and ‘climate catastrophe’ are now common in everyday conversations. As with any perceived global threat, there will always be sceptics who resist the mainstream narrative.
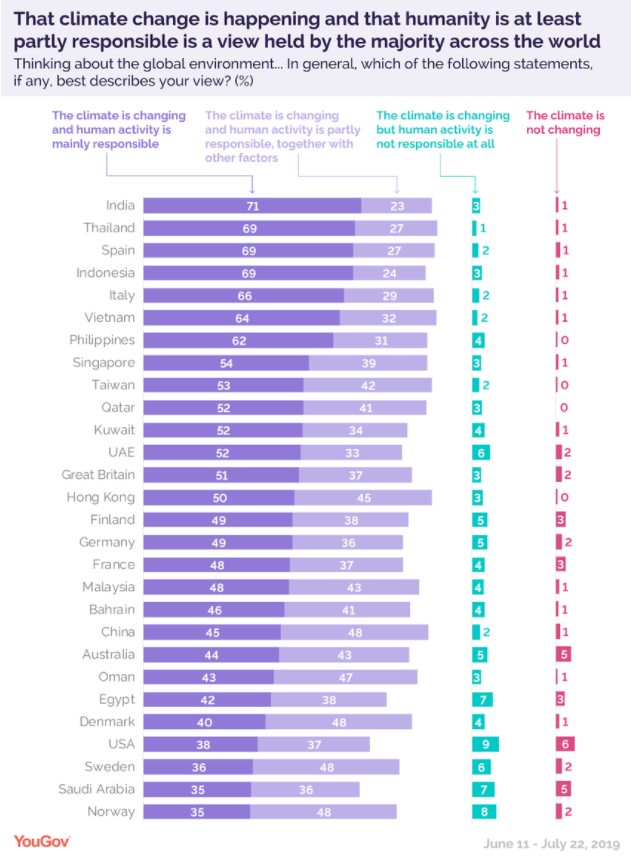
On a planet of nearly 7.9 billion people, collectively governed by 195 states, differing opinions are inevitable. The good news is that over 90% of people now acknowledge that our climate is changing. However, opinions diverge on two key points:
A 2019 YouGov survey recorded the following responses:
Those in the green category often cite natural planetary cycles, with some referencing polar ice changes on Mars. Sceptics in the red category deny climate change entirely, claiming it is a hoax.

Image: YouGov
Taking action to counter climate change is a monumental task. Solving any problem requires understanding its cause. With economic stakes so high, a lack of consensus about causes and threats hinders effective policy change, especially in economies reliant on fossil fuels.
The impacts of climate change are multi-faceted: droughts, wildfires, crop failures, ocean acidification, flooding and ecosystem collapse. But one impact stands out as truly transformative: sea-level rise.
Sea-level rise is slow and cumulative, gradually moving coastlines inland. For many, this concept is difficult to grasp. Skeptics often dismiss it because predictions from decades ago did not match reality exactly, citing locations expected to be underwater by 2020 that remain above sea level.
So, is sea-level rise real? And is global warming caused by human activity, natural cycles, or both?
Scientists have studied Earth’s climate for centuries, conducting experiments and expeditions to understand how internal and external factors shape our environment.
Ice Core Evidence
Satellites and ice core samples provide highly accurate data on past climate. Ice cores from Greenland (140,000 years) and Antarctica (800,000 years) reveal atmospheric composition and temperature over millennia. These natural records confirm historical cycles long before humans existed.
The Role of the IPCC
The Intergovernmental Panel on Climate Change (IPCC), established in 1988, collates evidence from thousands of studies. The latest IPCC report (2021) confirms that climate change is real and primarily human-driven, due to fossil fuel combustion, deforestation and land-use changes.
Atmospheric CO₂ is at its highest in two million years, with methane and nitrous oxide at their highest levels in 800,000 years.
Ice ages are closely linked to the Milankovitch Cycles, which describe three cyclical patterns of Earth’s movement around the Sun: tilt, eccentricity, and precession. Over each ~100,000-year cycle, slight fluctuations in Earth’s tilt and orbit affect the amount of solar radiation reaching the planet.
Earth’s orbit is not perfectly circular. The gravitational pull of Jupiter and Saturn, relative to the Sun, can shift Earth slightly closer to or further from the Sun during its orbit. Combined with changes in tilt and precession, these factors influence the amount of solar energy received, driving long-term warming and cooling cycles.
For the last three to four million years, ice age cycles have followed a regular pattern in step with these Milankovitch Cycles. Each cycle typically consists of:
These external planetary factors, together with Earth’s internal environmental processes, move the planet between periods of warming and cooling. Although this process is very slow, it is highly cyclical, and we have the evidence to prove it.
These same cycles also drive changes in regional climates. For example, the Sahara alternates between desert and savanna grassland approximately every 20,000 years.
Looking at hundreds of thousands of years of Milankovitch Cycles, our current interglacial warm period should already be entering a cooling phase and we would now be in a mild ice age. Yet for the first time in millennia, this natural cooling has not occurred.
It may be difficult to conceive that human activity in such a short timeframe could disrupt millions of years of planetary cycles, but the evidence is clear, it is happening. And it is a sobering thought.
Two major events in human history have profoundly altered Earth’s natural climate cycles.
1. The Dawn of Agriculture
Around 10,000 years ago, during a warm peak when Earth should have begun a gradual cooling, our ancestors discovered agriculture. Farming allowed for a mass availability of food, enabling human populations to thrive and multiply.
However, this progress came with a cost. Large-scale deforestation occurred as forests were cleared to make way for farmland. The carbon dioxide (CO2) stored in these trees was released into the atmosphere, causing the planet to warm, slightly at first, but enough to offset the natural cooling process.
This early human activity helped maintain a stable climate and sea level for the last 10,000 years. It also explains why the concept of rising oceans is so hard to imagine: throughout all recorded human history, we have only known a stable ocean and coastline.
2. The Industrial Revolution
Fast forward to 1712, when Thomas Newcomen invented the first widely used steam engine, ushering in the Industrial Revolution. This period marked the industrial-scale use of coal, triggering unprecedented technological advancements and rapid population growth.
However, the industrial use of fossil fuels released huge amounts of CO2 into the atmosphere. While Earth has a natural CO2 cycle, where carbon is absorbed by plants and animals, the volume of extra CO2 from industrial activity cannot be absorbed naturally, and its effects are now fully taking hold.
The Earth is made up of incredibly complex systems that are hyper-sensitive to even the smallest changes in average temperature. Over the last 2.5 million years, during multiple ice ages, global average temperature has fluctuated by only 5 degrees Celsius (9 degrees Fahrenheit).
According to the National Oceanic and Atmospheric Administration (NOAA), the current global average temperature is 13.9 degrees Celsius. Elon Musk helped put this into context by stating that relative to absolute zero, -5 degrees Celsius would put New York under a blanket of ice, and +5 degrees Celsius would put New York underwater.
The Challenge of Limiting Global Warming
To achieve the IPCC target of limiting the rise in global average temperature to no more than 1.5 degrees Celsius above pre-industrial levels, the world would need to:
Many experts now consider these targets practically impossible, particularly without the cooperation of the largest developed nations responsible for the majority of greenhouse gas emissions. Consensus is that warming of at least 2 degrees Celsius is almost certain.
Linking CO2, Temperature, and Sea-Level Rise
The chart below, produced by sea-level rise expert John Englander and adapted from Hansen and Sato, spans the last 400,000 years, showing the last four ice age cycles. Peaks and troughs illustrate the Earth’s warming and cooling. Around 120,000 years ago, at the peak of the last warm period, sea level was 23 feet higher than today.
The graph demonstrates the correlation between atmospheric CO2 levels, global average temperature, and sea-level changes. While the three lines follow the same trend, there is a small lag between them. First, CO2 levels rise, which increases global temperature, which then melts ice and drives sea-level rise.
Human Civilization and the CO2 Spike
Human civilization appeared at the end of the last warming period, right at the tip of the last peaks in the graphs. For all recorded history, sea level has been stable. Without humans, the Earth would have begun the next natural cooling cycle, but this did not happen.
The green line on the graph illustrates the problem. CO2 levels have increased exponentially over the last 250 years, starting with the widespread burning of fossil fuels. In June 2022, CO2 peaked at 421 ppm. Land-based ice, particularly in Greenland, is melting at ever-increasing rates, with the rate having tripled in the last 30 years.
Greenland and Antarctica: The Ice Sheets
Other ice locations, such as mountain glaciers, have minimal impact compared to Greenland and Antarctica, which hold the majority of land-based ice. Interestingly, sea-level does not rise equally around the globe. As land-based ice melts, the loss of mass changes Earth’s gravitational field, creating unique patterns of sea-level change.
Rising Seas: Historical Context
Since 1900, sea level has risen about eight inches (21 cm) on average, with three inches occurring since 1993. Between 1900 and 2000, the annual rise ranged from 1.2mm to 1.7mm. In the 1990s, the rate doubled, and it is now around 5mm per year, measured by tide gauges and satellites.
Claims that photographs proving sea-level rise are a hoax are misleading. Global averages mean some locations rise more than others, and century-old photos cannot reliably capture these small changes. Comparing images over a 100-year timeframe is like visiting a harbour for 20 minutes at high tide and refusing to believe tides change daily.
Exponential Growth and Thermal Expansion
As ice coverage decreases, less sunlight is reflected, and more heat is absorbed into oceans, accelerating warming. Sea-level rise is doubling, leading to exponential growth, similar to grains of rice on a chessboard.
Up to 90% of solar heat energy is stored in the oceans. As oceans warm, water expands (thermal expansion), contributing further to sea-level rise. Around four inches of the eight-inch rise this century is due to thermal expansion, but melting Greenland and Antarctic ice will have the larger impact.
Warming oceans also release stored CO2, reinforcing the problem. Even if humans went completely carbon neutral today, the heat already stored in the oceans ensures continued warming and melting for hundreds of years.
Sea-level rise cannot be stopped, but it is not an extinction-level event for humanity. As shown in the CO2, temperature and sea-level rise graph, human civilisation emerged at a time when most of Earth’s freshwater was already liquid rather than frozen. Although ice remains in the polar regions, it is relatively small compared to the depths of an ice age.
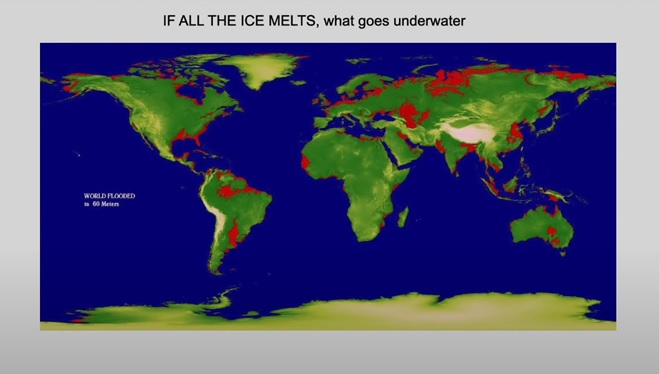
If All the Ice Melted
The red areas on the map below illustrate regions that would be submerged if all ice melted. While the total land surface affected may seem relatively small, the impact is far from negligible.
Historically, humans have built hundreds of major cities along coastlines, which will face significant challenges as oceans rise. Interestingly, 12 inches (1 foot) of vertical sea-level rise moves global shorelines inland by about 300 feet on average. This gradual encroachment could displace millions of people and threaten entire cities.

Image: John Englander RI Lecture.
Projected Impacts by 2100
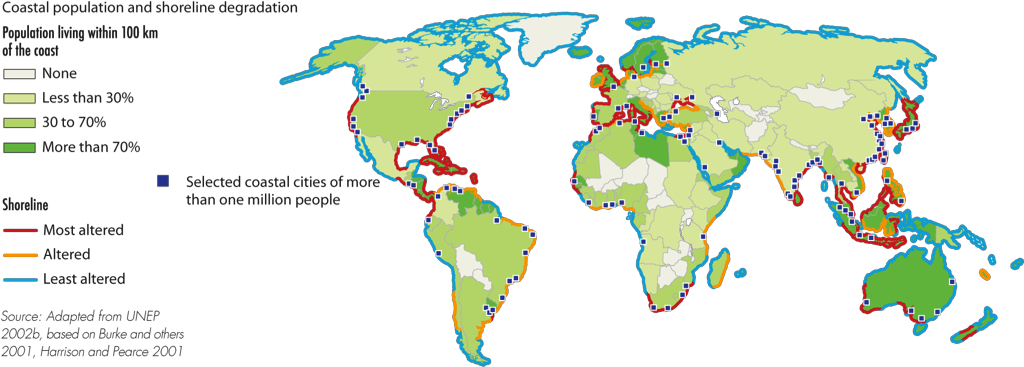
A 1 metre rise in sea level by 2100 is expected to directly affect around 410 million people living in coastal regions worldwide. Some of the most at-risk cities include:

Coastal population and shoreline degradation. Image: Grida
So how much and how fast will sea-level rise? The frustrating truth is nobody really knows. Many variables affect the rate at which land-based ice will melt, including what actions we take to curb global warming. While projections are difficult, computer models are improving as we monitor ice melt and gather more data. What we do know is that the process has started, ice is melting at increasing rates, and the rate of sea-level rise is now doubling.
Uncertainty in Projections
Historical data shows that sea-level does not always rise steadily. Rates change due to many factors, which makes predicting the future extremely challenging. Importantly, past projections have consistently underestimated actual sea-level rise, meaning reality has often outpaced expectations.
As can be seen in the graph below from www.nrdc.org, very different scenarios project very different outcomes. However, in what is regarded as an extreme worst-case scenario (a world where we fail to curb future emissions), it’s expected that we could see as much as 2.4 metres (8 feet) rise in sea-level by 2100. For context, the last sudden global sea-level change occurred 14,000 years ago, when sea-level rose 20 metres (65 feet) in just 400 years, averaging 0.5 metres (1.5 feet) per decade.
When the Greenland and Antarctic ice sheets are fully melted, global sea level would be 64 metres (212 feet) higher than today. How long this would take, 300 years or 3000 years, remains uncertain, but the impacts will intensify this century, forcing millions to relocate and causing trillions of dollars in damage to infrastructure.
The Good News
According to John Englander, there is a silver lining. Firstly, we can see this threat coming. Few global crises provide the gift of foresight. Secondly, we have time to act and mitigate the worst impacts. This requires:
Acting as a Species
As a planetary species, we face the greatest challenge in our history. We must adapt, relocate, plan and prepare for the changes ahead. The rise in sea-level that awaits us is unprecedented in modern human history. While it cannot be stopped, by working together, we can minimise its impacts and safeguard the future of our communities and ecosystems.