This blog has been written by The Flood Hub People.
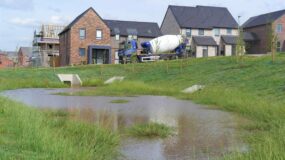
In England there are around 6.3 million properties at risk of flooding. If that’s not alarming enough, around two-thirds (67%) do not understand their flood risk. With many properties at risk from multiple sources of flooding and the average UK household more likely to get flooded than burgled, we need to make the complex topic of flood risk easy to understand.
This blog focuses on river flooding events, also known as ‘fluvial’ events. They have the largest impacts on communities, gain the greatest media attention and often use return periods to refer to floods as a “1-in -‘X’-year” event. But what does this actually mean and why is the use of return periods not the best means of communicating flood risk.
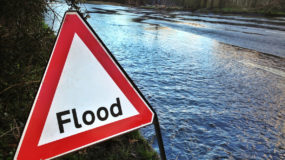
Flooding can be confusing and worrying. Knowing your flood risk is the first step to protecting your home and family.
Before we get into the technical details it is worth checking your own risk. You can do this quickly and easily using online flood maps. These maps show areas that could be affected by rivers or the sea and allow you to see whether your property lies in a flood zone. The maps use colour-coded bands to show low, medium or high risk so you can get a clear picture at a glance.
The following maps have been produced by the Environment Agency and are a great starting point:
Understanding where your property sits in these bands is useful. It can also guide you on what steps to take next, whether that is making your home more resilient or finding out more from a professional flood risk assessment.
Return periods, also called recurrence intervals, are calculated using historical river level data. River monitoring stations measure the flow of water in cubic metres per second. Hydrologists use this data to estimate how often a river is likely to reach certain levels.
Computer models simulate different rainfall events and how they affect river flow. Many factors are included in these models. These include the type of land surfaces, run-off rates, the paths water takes through the catchment, climate change projections and the river channel itself.
Return periods can change over time. As new floods happen more data becomes available and calculations are updated. A flood may initially be described as a “1-in-100-year” event but later reclassified as a “1-in-80-year” event. Return periods are not exact. A “1-in-100-year” flood can happen once, twice or more, or not at all, in a 100-year period.
Return periods can also give the wrong impression. When mentioned on TV or in newspapers, they suggest floods are predictable. People may think that after a “1-in-100-year” flood, the next one will not happen for another 100 years. In reality there is a 63.4% chance of one or more “1-in-100-year” floods happening in any 100-year period.
Rather than state return periods, a clearer way to communicate risk is using percentages. This shows the probability of a flood happening in any one year. This is called the Annual Exceedance Probability or AEP.
| Return Period (years) | Probability (annual exceedance probability) | Chance of occurrence in any one year |
| 2 | 0.5 | 50% |
| 10 | 0.1 | 10% |
| 25 | 0.04 | 4% |
| 50 | 0.02 | 2% |
| 100 | 0.01 | 1% |
| 150 | 0.002 | 0.2% |
| 1000 | 0.001 | 0.1% |
For example:
The Environment Agency groups AEP into four risk categories: very low, low, medium and high. Online flood maps use different shades of blue to show these bands. The darker the blue the higher the risk. You can check your flood risk online by entering your property number and postcode here.
| RISK CATEGORY | Very Low | Low | Medium | High |
| %AEP BAND | Less than | Between | Between | More than |
| < 0.1 | 0.1 > 1 | 1 > 3.3 | > 3.3 |
Environment Agency Flood Risk Categories
These risk bands give a broad picture of flood risk. They are easy to understand and help you know whether your property is at higher or lower risk. However they do not give detailed context. They cannot tell you if the level of risk is acceptable for your circumstances.
If you want to understand your flood risk in more detail, you would be advised to obtain a site-specific flood risk assessment for your property, produced in consultation with a professional. The flood risk specialist can utilise detailed data sets and maps to assess risk from different sources and determine expected flood depths at a given location, across a range of return periods (or different level of events). They can also physically survey the site to assess property specific flood risk attributes such as elevation. In some cases, residents have successfully disputed their property’s level of flood risk by having a flood risk assessment carried out for their property and demonstrated to insurers that their risk is actually lower than stated. The four risk bands give you a broad picture, but they are not designed to present you with detail.
There is another thing to consider, with ‘annual’ exceedance probability, each year is effectively a new role of a dice. For the ‘1-in-100-year’ event, a 100-sided die, known as a Polyhedral die, would be used and a flood would be indicated by say… rolling a number 5. With each roll, the chance of rolling a number 5 (a flood) remains the same; a 1-in-100 chance, or 1%. The probability of a flood remains the same for each consecutive year the die is rolled. However, the more times you roll the die, the chances of hitting a number 5 are inevitably increased!
In reality, the vast majority of people do not live at a property for just one year; especially if they are buying it as opposed to renting. In determining whether a property’s level of flood risk is acceptable or not, it is useful to consider the duration of time that you expect to live there. While ‘annual’ exceedance probability looks at the risk of flooding annually, it may also be worth knowing your chances of experiencing a flood across a longer time frame, such as the 10, 20 or even 30 year period of time that you may reside at the property. The results are surprising!
As can be seen from the table below, if you’re buying a property with a 0.1%AEP (the bottom end of the ‘Low’ risk band) and expect to live there for only 1 year, the chance of a flood is 0.1%. If you expect to live there for 20 years, the probability of you experiencing a flood within that time period increases to just short of 2%; still relatively low indeed. In contrast however, if your property falls at the top end of the ‘Low’ risk band at 0.99%AEP; your chances of experiencing a flood over the same 20-year period would be 18.04%! While a 0.99% chance of a flood occurring each year sounds low, if you knew that there was nearly a 1-in-5 chance you’d experience a flood at some point within the next 20 years, would you still buy that property?
| Risk Category |
%AEP BAND |
BAND SPLIT |
% AEP (Risk in any given year) |
PERCENTAGE PROBABILITY OF A FLOOD EVENT OVER TIME (YEARS) | |||||||
| 1 | 3 | 5 | 10 | 15 | 20 | 25 | 30 | ||||
| Very low | < 0.1 | Bottom | 0.01 | 0.01 | 0.03 | 0.05 | 0.10 | 0.15 | 0.20 | 0.25 | 0.30 |
| Middle | 0.05 | 0.05 | 0.15 | 0.25 | 0.50 | 0.75 | 1.00 | 1.24 | 1.49 | ||
| Top | 0.09 | 0.10 | 0.30 | 0.49 | 0.99 | 1.47 | 1.96 | 2.45 | 2.93 | ||
| Low | 0.1 > 0.99 | Bottom | 0.1 | 0.10 | 0.30 | 0.50 | 1.00 | 1.49 | 1.98 | 2.47 | 2.96 |
| Middle | 0.5 | 0.50 | 1.49 | 2.45 | 4.89 | 7.24 | 9.54 | 11.78 | 13.96 | ||
| Top | 0.99 | 0.99 | 2.94 | 4.85 | 9.47 | 13.86 | 18.04 | 22.02 | 25.81 | ||
| Medium | 1 > 3.3 | Bottom | 1 | 1.00 | 2.97 | 4.90 | 9.56 | 13.99 | 18.21 | 22.22 | 26.03 |
| Middle | 2.1 | 2.15 | 6.31 | 10.30 | 19.53 | 27.82 | 35.25 | 41.92 | 47.90 | ||
| Top | 3.3 | 3.30 | 9.58 | 15.45 | 28.51 | 39.55 | 48.89 | 56.78 | 63.46 | ||
| High | > 3.3 | Bottom | 3.4 | 3.40 | 9.86 | 15.88 | 29.24 | 40.48 | 49.93 | 57.89 | 64.57 |
| Middle | 4.1 | 4.15 | 11.94 | 19.10 | 34.55 | 47.05 | 57.16 | 65.34 | 71.96 | ||
| Top | 5 | 5.00 | 14.26 | 22.62 | 40.13 | 53.67 | 64.15 | 72.26 | 78.54 | ||
Flood Risk Probability Chart
For some property owners, a 2% chance of flooding may be an acceptable level of risk to take over a 20-year period, whereas an 18% chance, close to 1 in 5, would not. Two very different flood risk outcomes in terms of probability and both falling within the same ‘Low’ risk category.
The understanding of flood risk could prove to be the greatest driver and motivator in encouraging people to become more flood resilient. If a property’s level of flood risk is unacceptable, the owner can make the most informed decision on whether to spend money protecting their home or move to a different location.
Online flood maps are a valuable resource and should be used by everyone at risk. They are a good starting point to understand whether a more detailed assessment is needed.
In the future these maps may be improved with more detailed data, allowing users to get a more accurate view of flood risk. Tools could also show the probability of flooding over the time you plan to live at your property.
While these tools help make flood risk easier to understand, it is important to remember that flooding is unpredictable. Hydrology is not exact and floods of any magnitude can happen at any time.